*Omics Visualizer* allows users to import data tables with multiple rows referring to the same network node and to visualize such data onto networks.
This is particularly useful for visualizing post-translational modification sites or peptides identified in proteomics studies as well as data measured under multiple conditions.
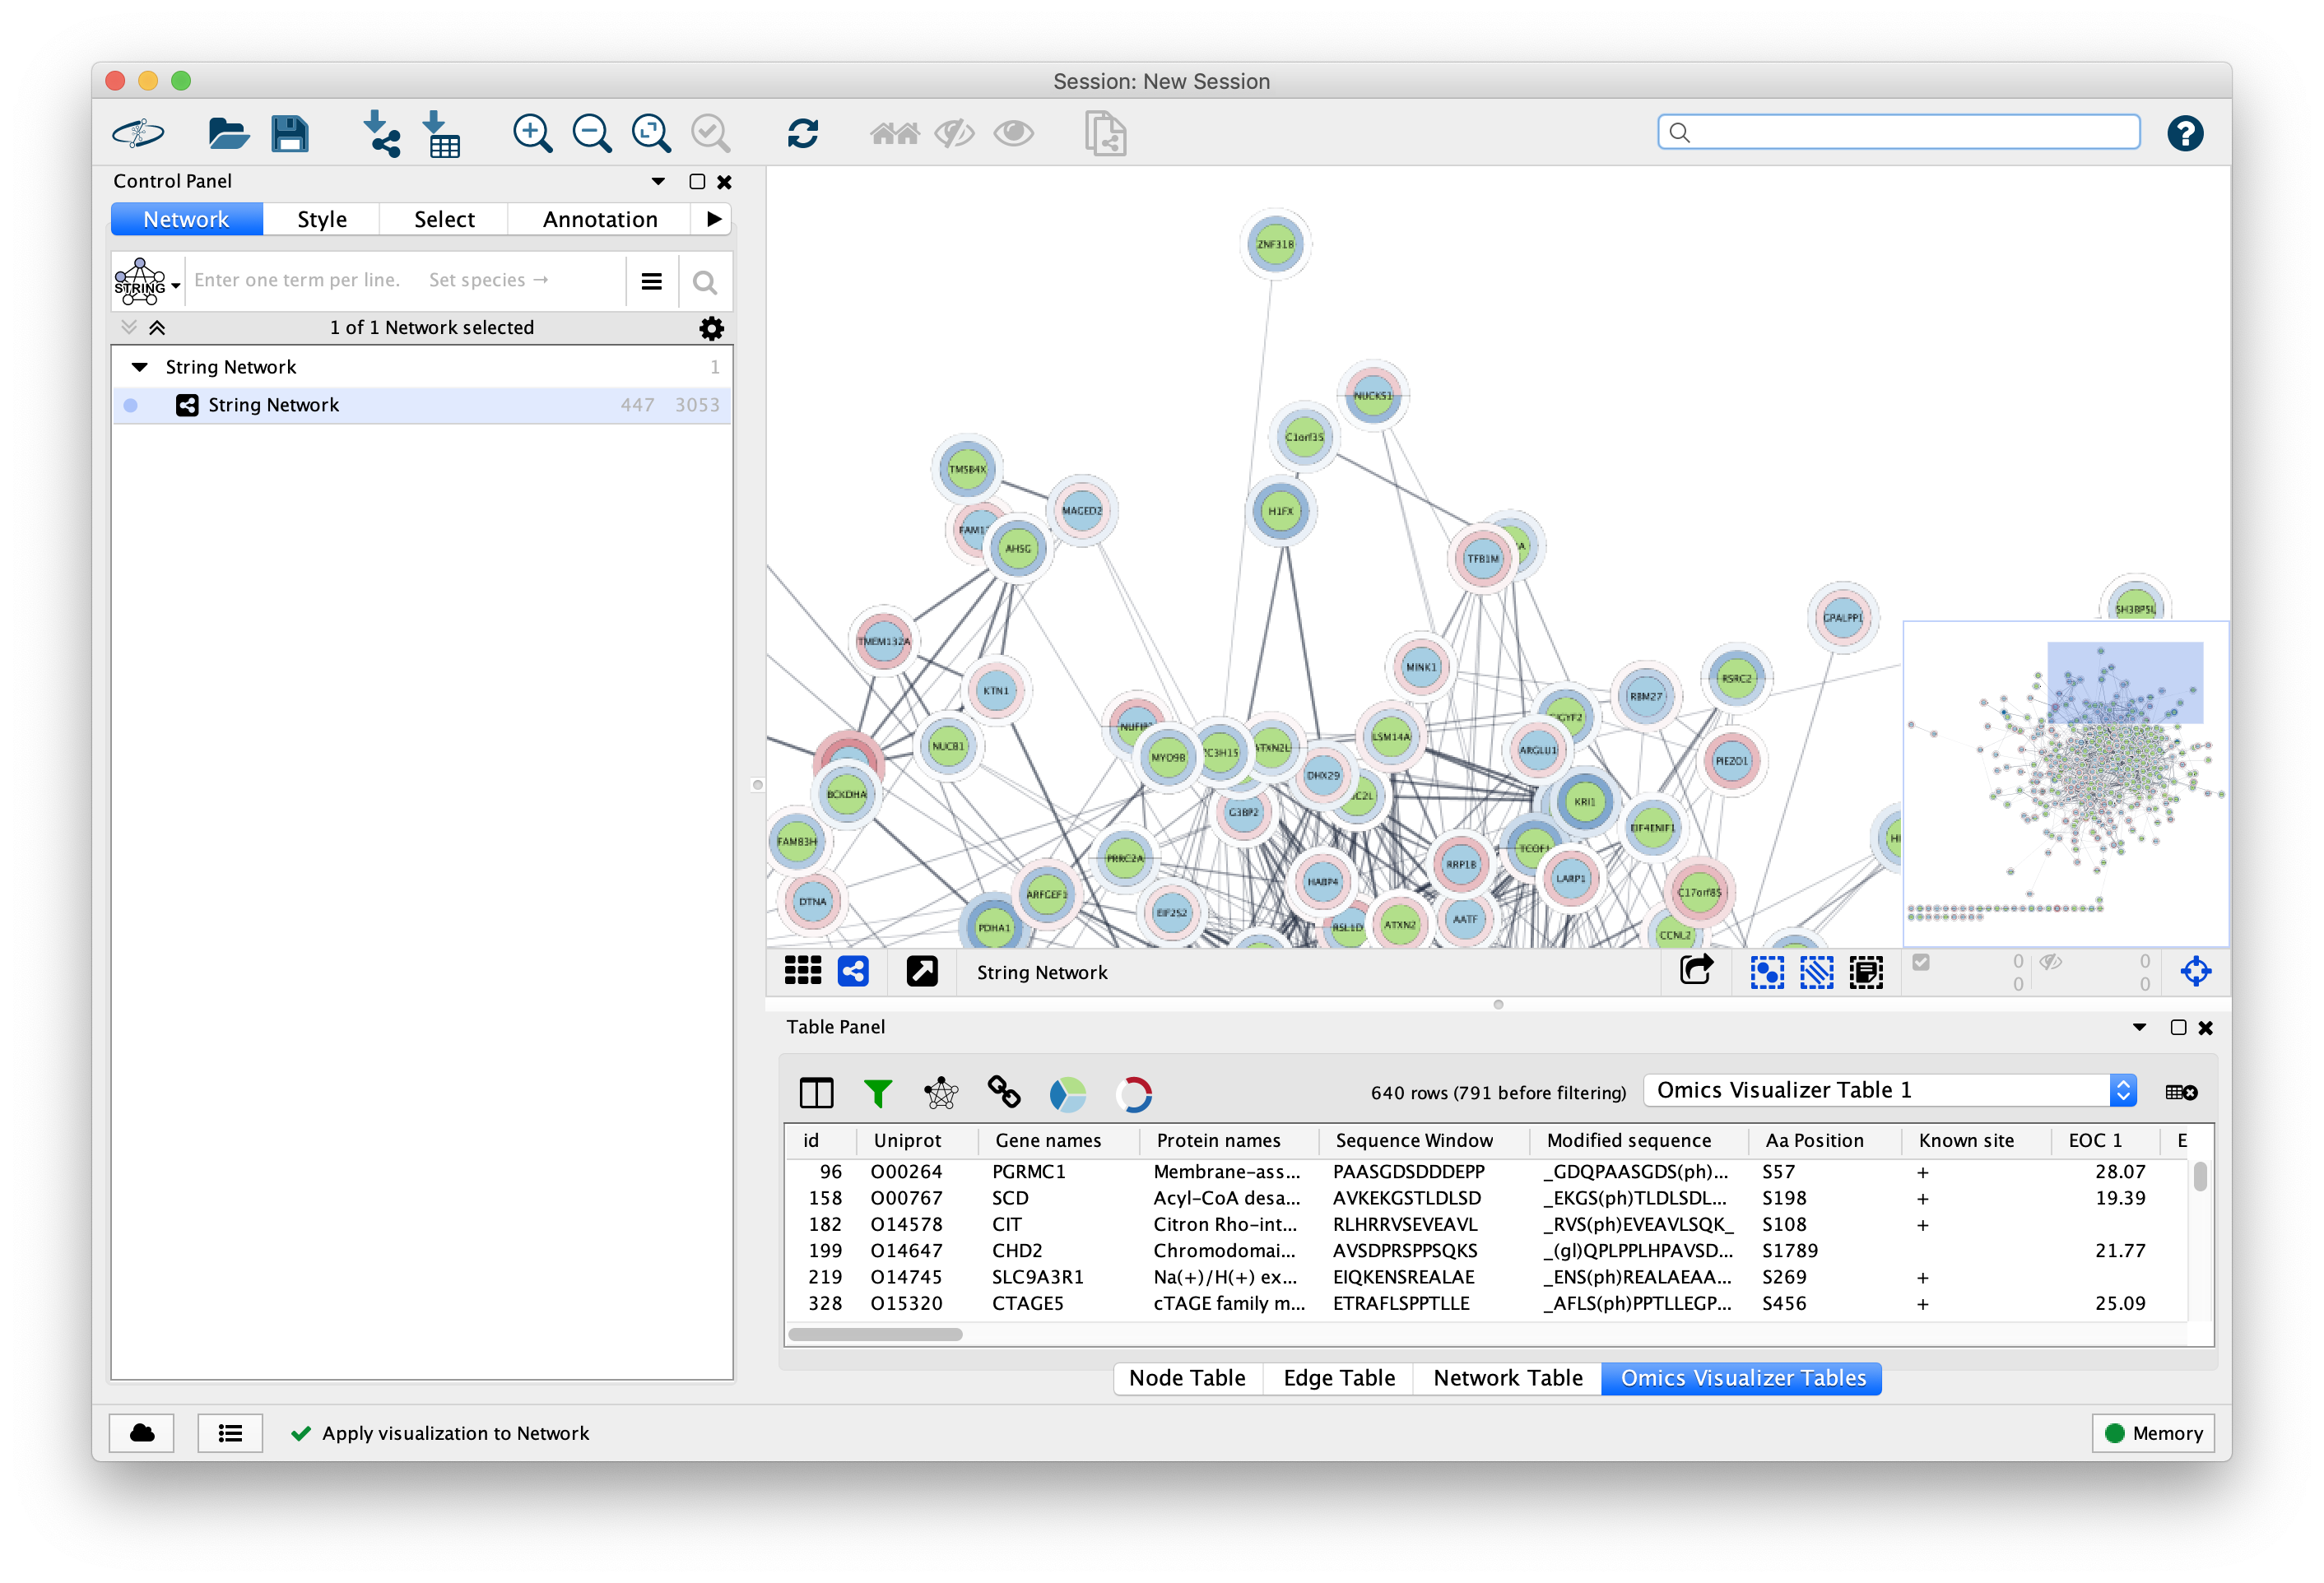
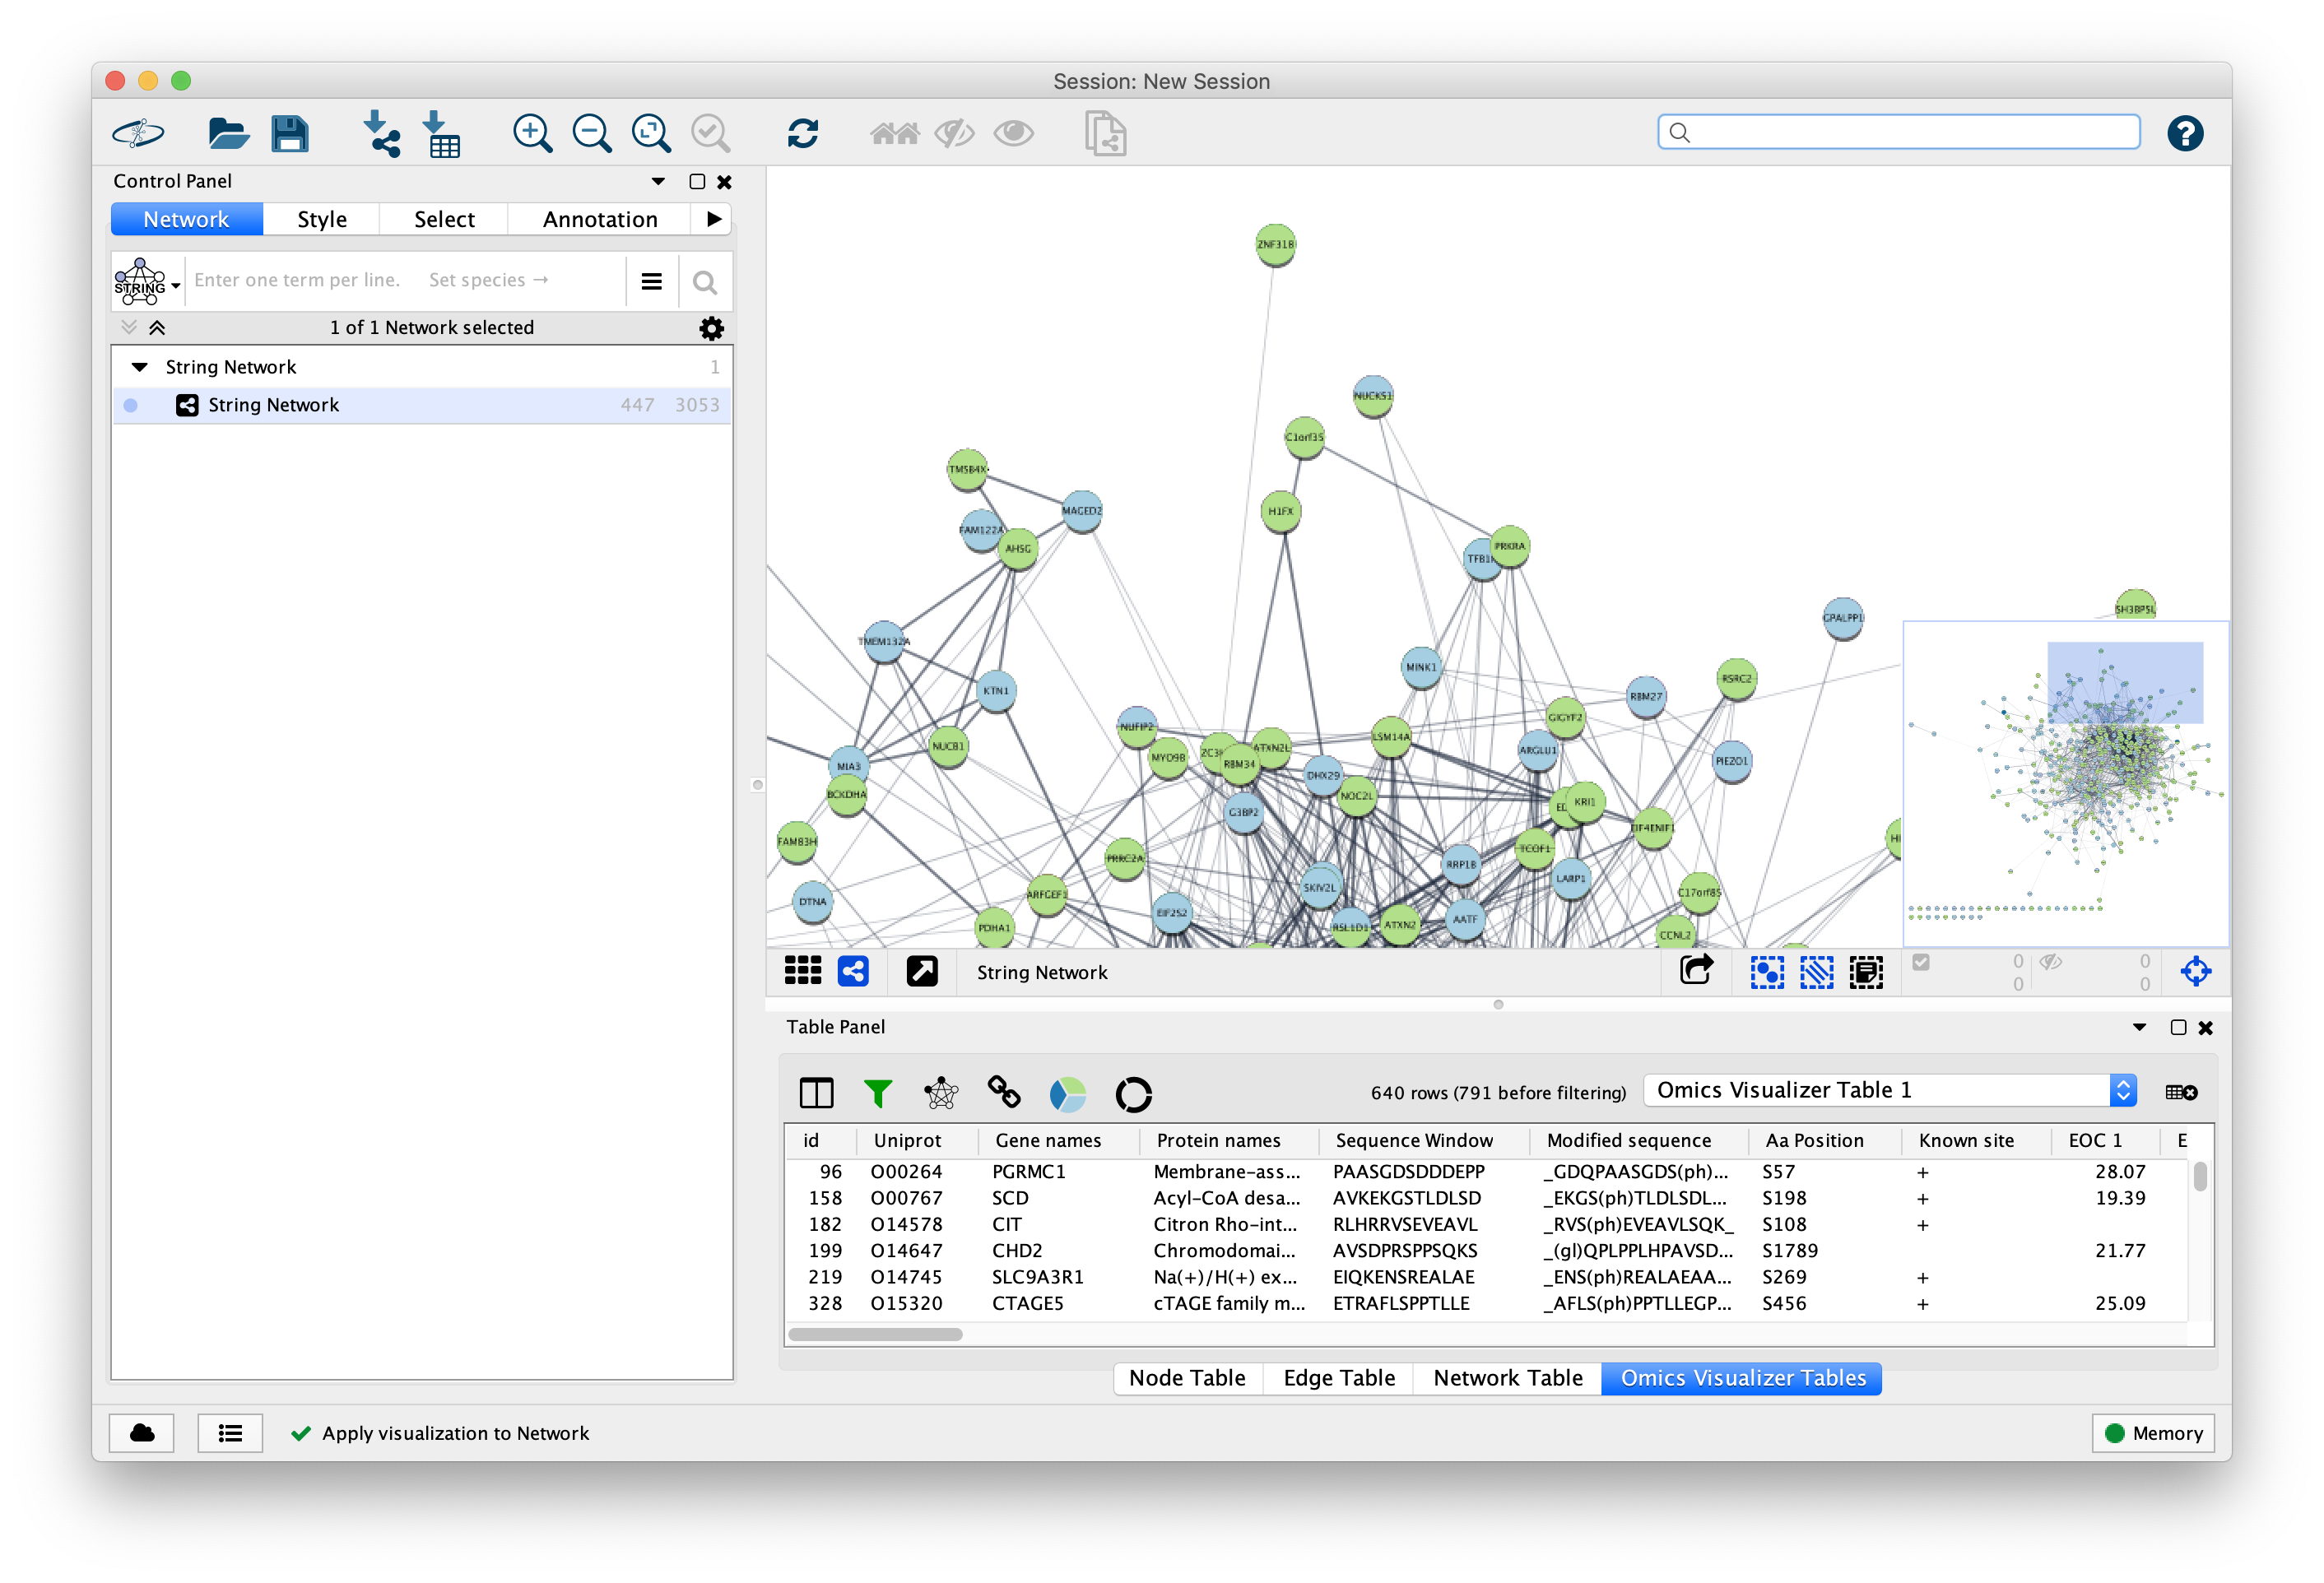
*Omics Visualizer* enables users to import a data table, connect it to one or more networks, and visualize the connected data onto networks.
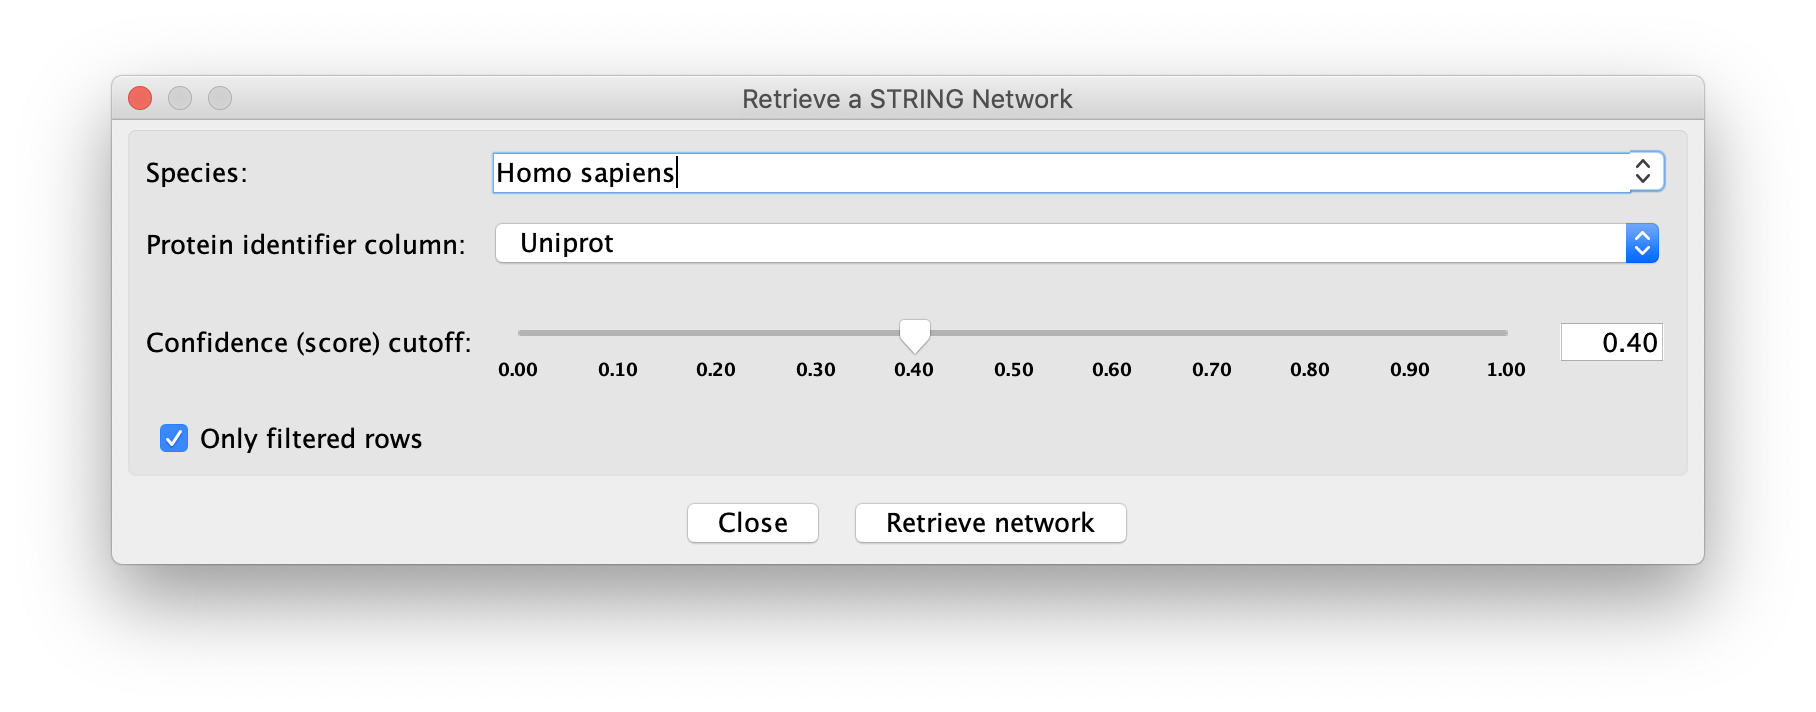
If the user does not provide a network, *Omics Visualizer* retrieves a network from the [STRING database](https://string-db.org/) using the Cytoscape [stringApp](http://apps.cytoscape.org/apps/stringapp).
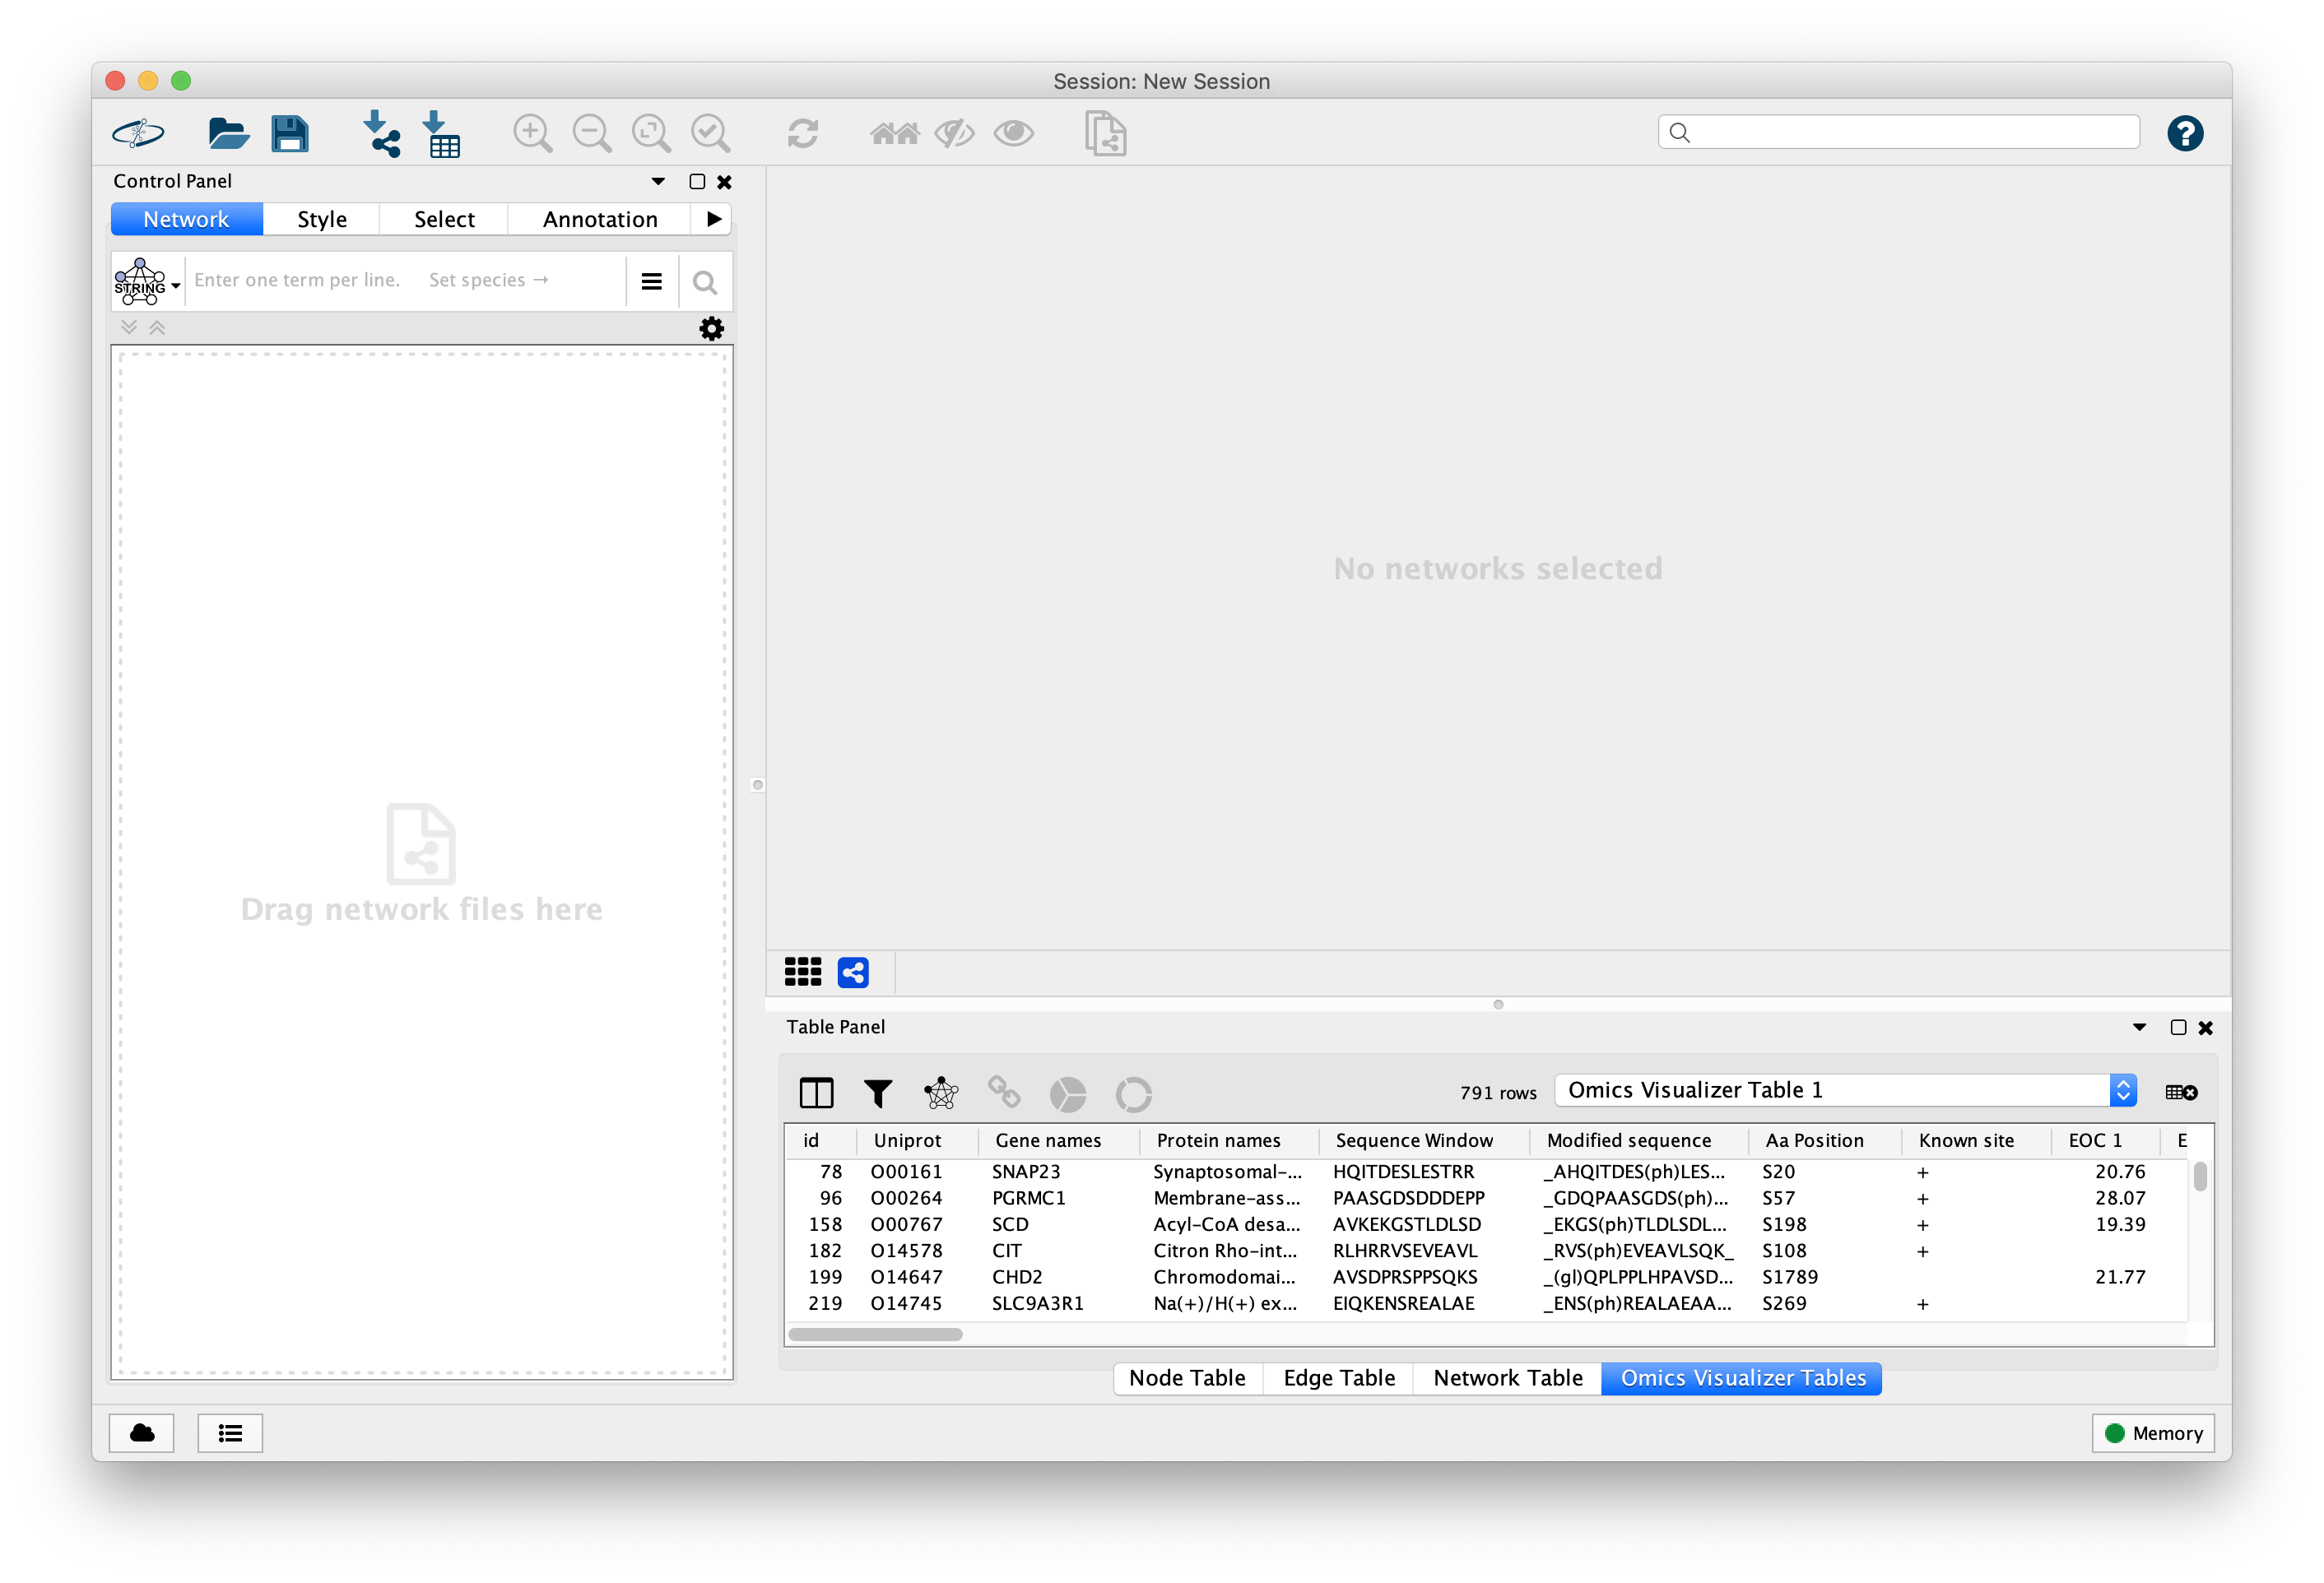
The *Omics Visualizer* table import mimics the Cytoscape default import process: it handles text and spreadsheet files, the user can select the columns to import and modify the auto-detected type for each.
The user can filter the rows from the imported table.
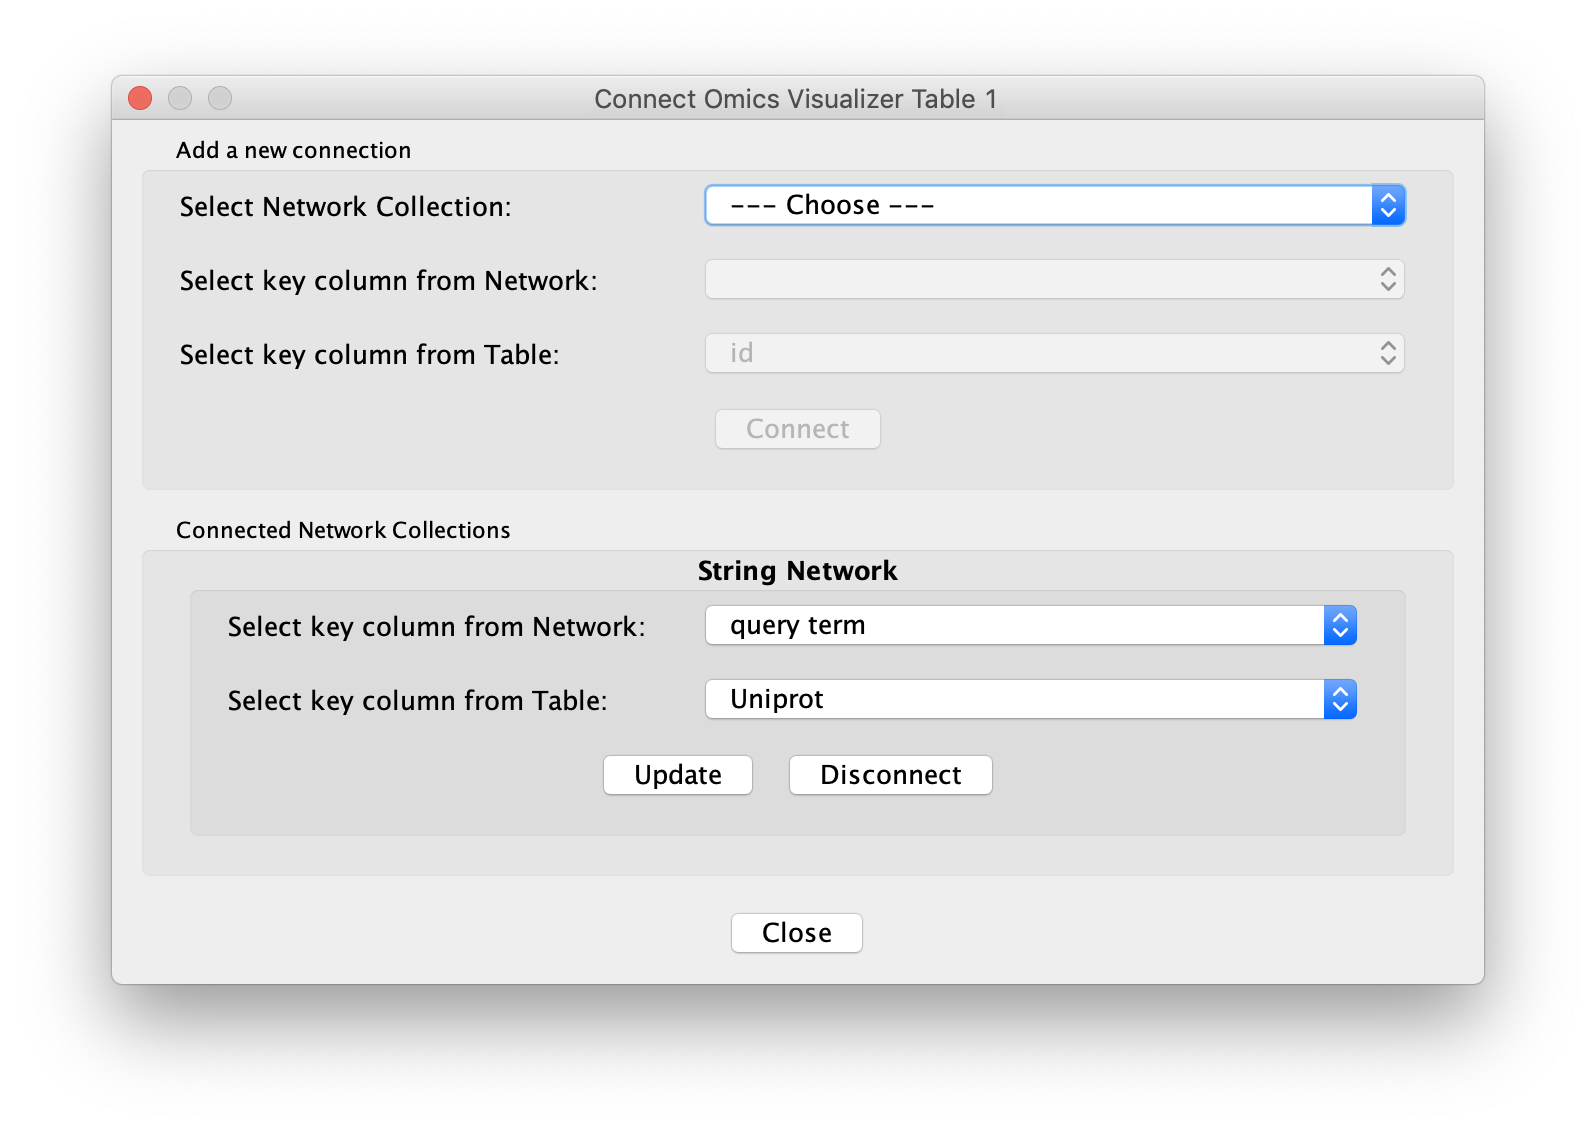
To connect a table with a network, the user must select the key columns from the node table and from the data table.
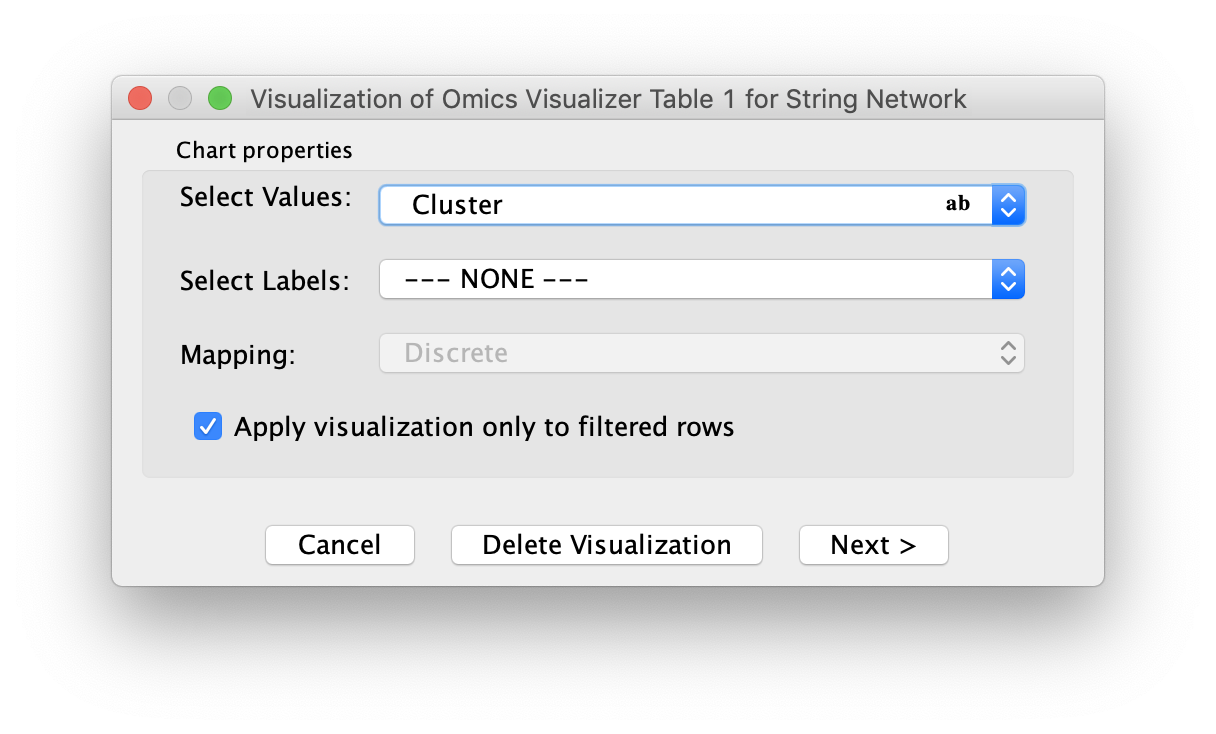
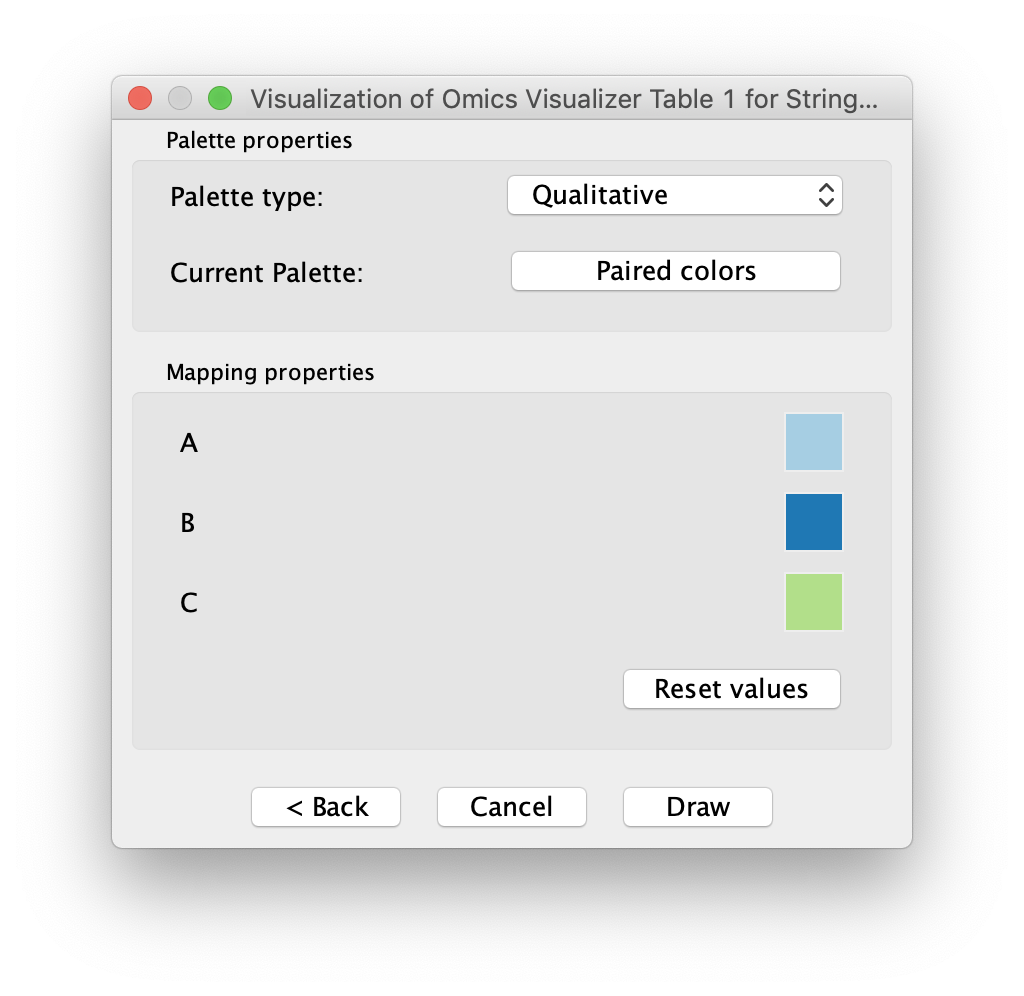
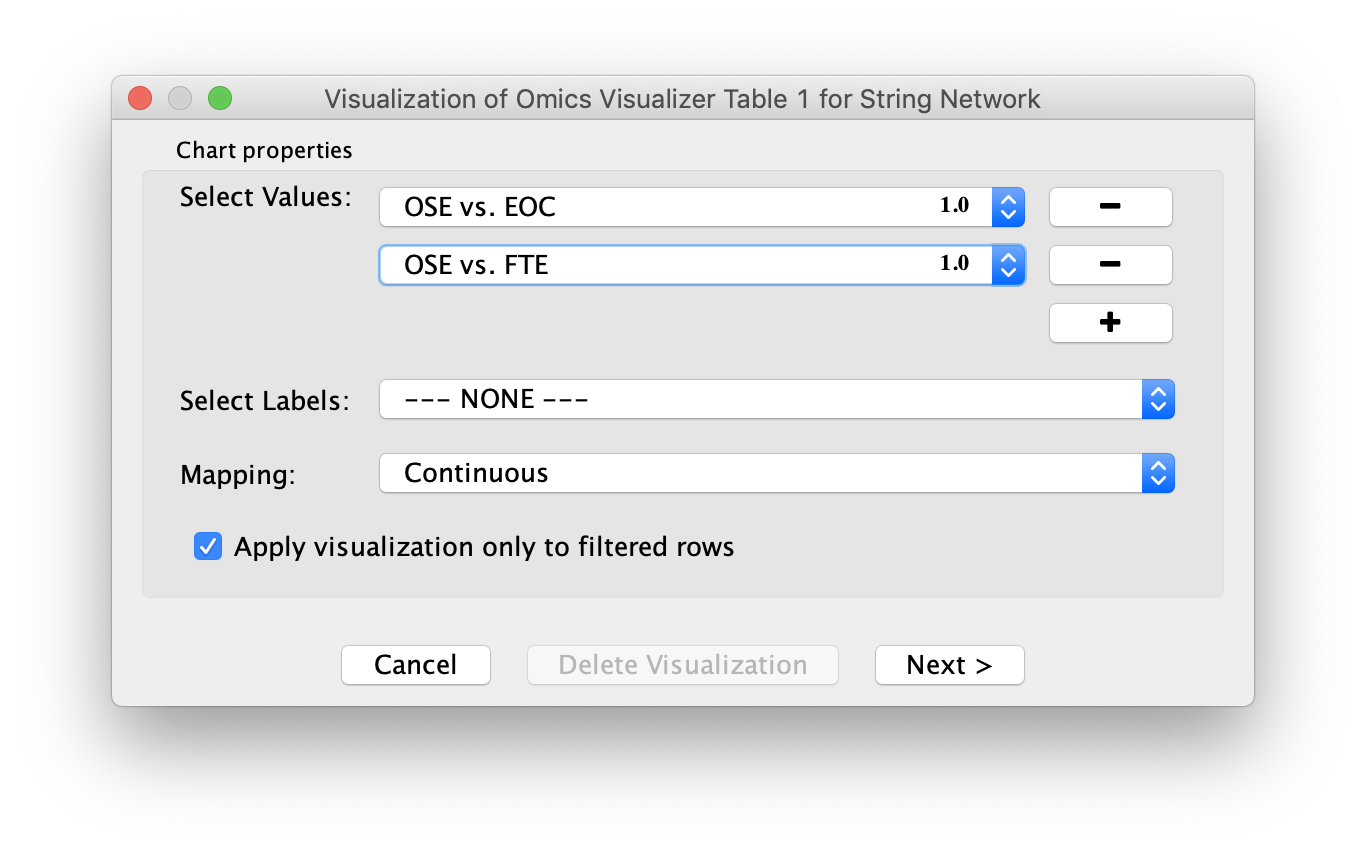
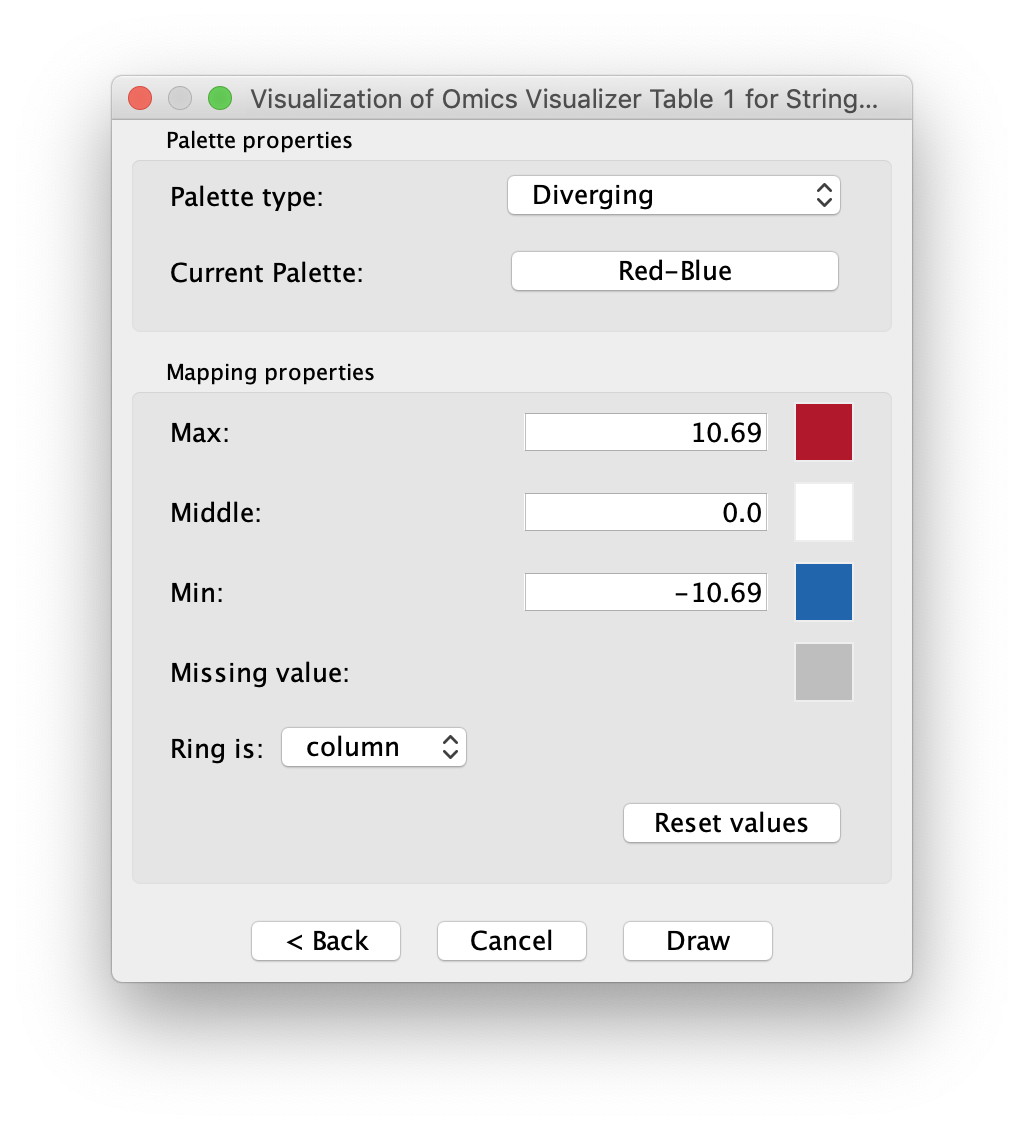
*Omics Visualizer* gives the possibility to represent continuous and discrete data from the table onto the network in two ways: either with a pie chart in the node, or with a donut chart around the node. A slice of the chart is a row from the table, and the color represents the value.
The charts are drawn by the [enhancedGraphics app](http://apps.cytoscape.org/apps/enhancedgraphics).